


Sensor Charts
Description of Sensor Charts
Sensor Charts
is a
powerful tool
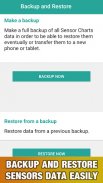
able to record automatically in
background
all sensors data and render it at your command in
wonderful
and
colorful charts
.
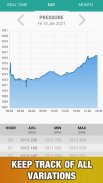
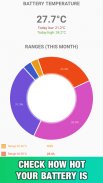
What was the day of August when the cell phone boiled with a stratospheric battery temperature? With Sensor Charts any data from your sensors like this will be within your reach, simply and effectively.
It supports
several sensor types
(multitool)*:
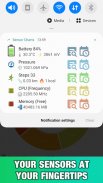
☁️ Pressure sensor
🧰 Gyroscope
🛳️ Magnetometer
💡 Light sensor
⚡️ Battery
⚡️ Battery Temperature
⚡️ Battery Voltage
🚀 Proximity sensor
📱 Memory (Free)
📱 RAM (Free)
📱 CPU (Frequency)
⛳️Compass
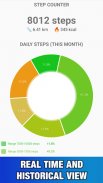
🏃 Step Counter
🌞 Screen Brightness
Sensor Charts
will show you
:
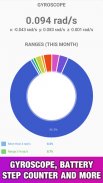
🌟
time ranges
in
pie charts
(to answer questions like: how long has your screen been turned off in the current month?)
🌟
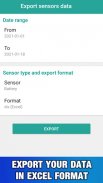
historic sensor data by day and month
in
linear charts
. You can
zoom
on charts with two fingers and check when your
battery
left you or when it was discharging very fast.
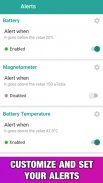
You'll be able also to set alerts for your sensors.
You can use Sensor Charts as your personal
tricorder
.
If your device has a step counter, Sensor Charts will give you also an estimate of the distance traveled and of calories burned.
Supported units of measure:
- Pressure: hPa, inHg, mmHg, psi
- Light: lux, fc
- Temperature: °C, °F, °K
- Distance: km, miles
*N.B.: Available sensors in the
multi-tool
depend on their actual presence on your device. Devices with a greater number of sensors can take full advantage of this app.
Sensor Charts - Version 2.0.3
(26-05-2024)Sensor Charts - APK Information
APK Version: 2.0.3Package: com.devnetplanet.sensorchartsLatest Version of Sensor Charts


 3.57
3.57


Apps in the same category


You may also like...


